NONMEM Users Guide Part V - Introductory Guide - Chapter 11
1. What This Chapter is About
2. The Stages of Model Building
3. Check-out — Index Plots
4. Building the Structural Part of the Model
4.1. A General Approach
4.2. The Minimal Model
4.3. Use of Constraints
4.4. Diagnostic Tools
4.4.1. Plot of DV vs PRED
4.4.2. Residual Plots
4.5. Judging Goodness of Fit
4.5.1. A Global Measure — Change in the ObjectiveFunction
4.5.2. Decrease in Unexplained Variability
4.5.3. Improvement in Plots
4.6. Using the Tools: Further Improvement
4.6.1. An Additional Effect of WT
4.6.2. The Effect of APGR
5. Building the Statistical Model
5.1. Judging Among Alternatives
5.1.1. Unexplained Variability
5.1.2. Residual Plots
6. Refine Model
6.1. Use of Standard Errors and Confidence Intervals
6.2. A Model Refinement
7. Testing the Model

NONMEM Users Guide Part V - Introductory Guide - Chapter 11

Chapter 11 - Model Building

1. What This Chapter is About

In this chapter, the simple phenobarbital example begun in Chapter 2 will be continued to illustrate how NONMEM is used to build a model for population data. The topic of model building, diagnosis and verification is a large one. This chapter can only give a very abbreviated example.

2. The Stages of Model Building

To analyze a population data set and build a model for it, one must proceed in logical stages. There are five stages, and their relationship to one another is presented diagrammatically in figure 11.1. One begins by checking the data. One then tries to find an adequate model incorporating the fixed effects; then an adequate model incorporating the random effects and describing random inter- and intra-individual variability. After a reasonably complete model is found, attempts are made to refine it, and finally, if desired, the various parts of the models (which often, in effect, simply assert the existence of certain relationships between independent variables and the dependent variable) can be subject to formal hypothesis tests, as described in Chapter 5. (However, it is well known by statisticians that formal hypothesis testing undertaken Image grohtml-151583-3.png model building is just an approximation for the type of hypothesis testing described in textbooks, which assumes that the model is the correct model).

Image +chapt11/fig11.1.ubuntu.epsi.png

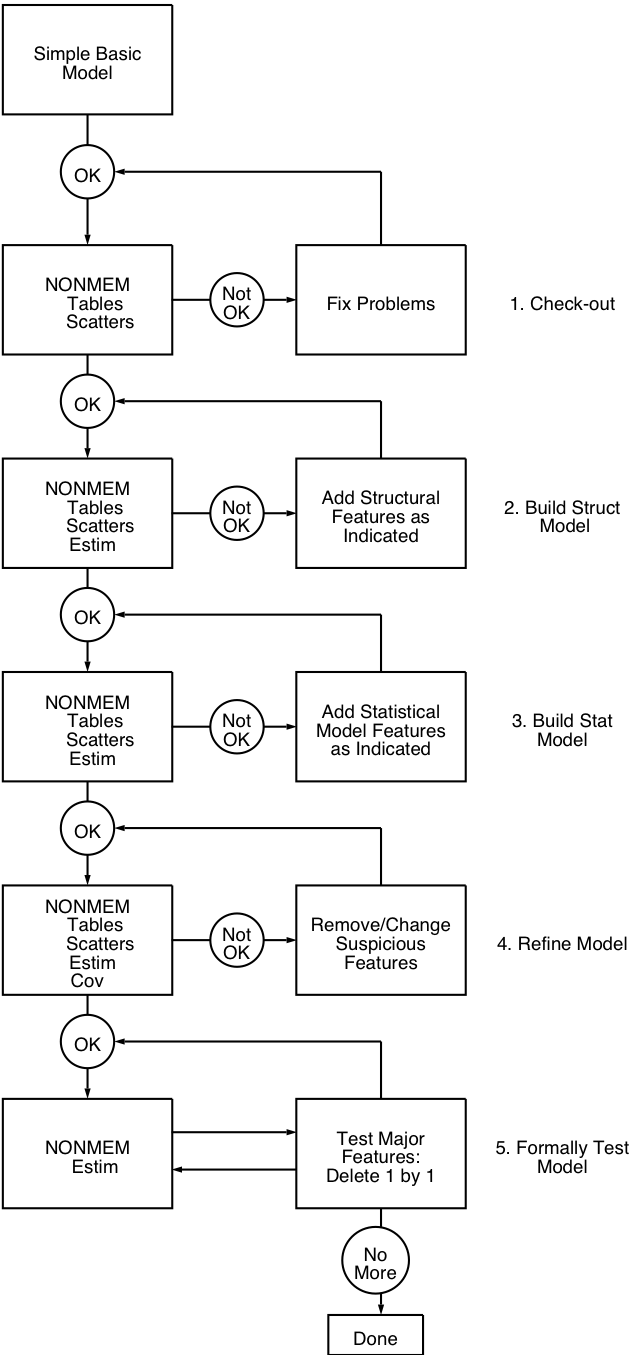
Figure 11.1. Stages in model building.

3. Check-out — Index Plots

The goal of this stage is to assure that the data are correct. There is no point to trying to model the data when gross errors are present. Most gross errors are encoding errors that cause certain values to be different from the intended value by a considerable amount (for example, a misplaced decimal point changes a value by a factor of 10), so that graphical display of the data is usually adequate to detect these. No numerical or statistical approaches are needed. Indeed, they are not usually useful, even for more subtle errors, as such errors cannot easily be detected by any means (how is a 10% error to be distinguished from inter- or intra-individual variability?).

To detect gross errors, then, one makes scatterplots of different data item types vs individuals’ identification numbers (i.e. the ID data item, or, if the values of this data item are arbitrary, another data item that identifies patients using sequential integer values; call this the sequence data item: SEQ). Such plots (of one data item versus ID or SEQ) are called here index plots, and are quite useful for revealing the structure of the data, as will be noted below, as well as for finding gross errors.

If NONMEM is used to make index plots, it will also be useful to implement the Tables Step, so that if a problem is noted in a scatterplot, one can refer to the table to try to find the datum that might account for the problem. To run NONMEM some model must be specified, even if all that is desired is an index plot. In such case, it makes little difference what model is used. It is easiest and useful to (i) start with a simple ADVAN that is likely to provide at least a roughly satisfactory fit, (ii) set each PK parameter to a (different) element of Image grohtml-151583-5.png , (iii) use only one Image grohtml-151583-6.png variable, modifying the scale parameter only, and one Image grohtml-151583-7.png variable, and (iv) use roughly reasonable fixed initial estimates.

For the phenobarbital example, one might use ADVAN1 with Image grohtml-151583-8.png , Image grohtml-151583-9.png , and Image grohtml-151583-10.png . Initial estimates might be: Image grohtml-151583-11.png = .0057 hr Image grohtml-151583-12.png (half-life = 5 days, a typical value for adults); Image grohtml-151583-13.png = 1.44 L. (the first patient has a concentration of 17.3 mg/L some few hours after an initial loading dose of 25 mg; 1.44 times 17.3 = 25); Image grohtml-151583-14.png = .25 (50% variability); Image grohtml-151583-15.png = .04 (20% variability).

Figures 11.2 and 11.3 show index plots that might be seen in a check-out run (gross errors have been added). In figure 11.2, DV is plotted vs ID (here ID and SEQ are the same), and a gross error occurring at about patient #13 is seen (an observation of about 24 mcg/ml was erroneously recorded as 240 mcg/ml). In figure 11.3, AMT is plotted vs ID, and patient #3 appears to have a grossly erroneous value (again, a decimal point error; a dose of 18 was misrecorded as 180).

              DV VS.   ID
   0.00E+00            5.00E+01            1.00E+02     DV     1.50E+02            2.00E+02            2.50E+02
          .                   .                   .                   .                   .                   .
          .         .         .         .         .         .         .         .         .         .         .
 -1.00E+00. . . . . . . . . . . . . . . . . . . . . . . . . . . . . . . . . . . . . . . . . . . . . . . . . . .
          .                                                                                                   .
          .   *  *  * **                                                                                      .
          .      *  2                                                                                         .
          .       * *  *                                                                                      .
          .     ***                                                                                           .
          .      2***  *                                                                                      .
          .         *   2                                                                                     .
          .       **  * *                                                                                     .
          .       **  *                                                                                       .
  1.14E+01.     **  *   *                                                                                     ..
          .              *                                                                                *   .
          .     *   3                                                                                         .
          .       *   *                                                                                       .
          .      *   *   *                                                                                    .
          .  *     2* 2 *                                                                                     .
          .       **   *                                                                                      .
          .        * *  *                                                                                     .
          .       2   *                                                                                       .
          .        2*2                                                                                        .
  2.38E+01.              2 *                                                                                  ..
          .    * * *  ** *                                                                                    .
          .          *  *                                                                                     .
          .      *   * *                                                                                      .
          .        *                                                                                          .
    ID    .      2                                                                                            .
          .         *                                                                                         .
          .    *  2* *                                                                                        .
          .        * *                                                                                        .
          .         *    *                                                                                    .
  3.62E+01.    *   *  *                                                                                       ..
          .    * ***  **                                                                                      .
          .      *    *  *                                                                                    .
          .    *    *                                                                                         .
          .      **  *                                                                                        .
          .    **  *                                                                                          .
          .    * *   *                                                                                        .
          .      ** *                                                                                         .
          .       *                                                                                           .
          .         *                                                                                         .
  4.86E+01.    *  * *   *22                                                                                   ..
          .        *  *          *   *                                                                        .
          .    *      **                                                                                      .
          .     *     *  *                                                                                    .
          .       * * 2* *                                                                                    .
          .       *                                                                                           .
          .       *                                                                                           .
          .       *  *                                                                                        .
          .        2 ** * *                                                                                   .
          .                                                                                                   .
  6.10E+01. . . . . . . . . . . . . . . . . . . . . . . . . . . . . . . . . . . . . . . . . . . . . . . . . . .
          .         .         .         .         .         .         .         .         .         .         .

Figure 11.2. A scatterplot of the dependent variable, DV, vs the patient’s ID number (a type of index plot). Note the outlier at about ID = 13.

Actually, figure 11.3 reveals a considerable amount about the data structure (this will be seen better in figure 11.4, below, when the outlier has been removed). Many points lie along the line AMT = 0, where one sees integers 5, 3, 3, 6, etc, as one proceeds along the ID axis, each integer indicating the corresponding number of points over-plotted at that location. They correspond to the observation records, since the doses on these records are all zero. Thus one can see how many observations each individual contributes (other type records would also plot at AMT=0, however). Proceeding to the next highest "line" of doses (where many points over-plot for each patient), one "sees" the event records giving the maintenance dose amount since this amount stays constant within a individual (many maintenance doses were given per individual), and this amount is approximately the same across individuals. Last, at the highest doses (except for the outlier), one has mostly single points. These are the loading doses. There is occasional over-plotting of loading-dose points. These points represent overlapping patient ID numbers (at the resolution of the NONMEM plot ), not multiple loading doses to the same patient.

             AMT VS.   ID
  -1.00E+01            3.00E+01            7.00E+01    AMT     1.10E+02            1.50E+02            1.90E+02
          .                   .                   .                   .                   .                   .
          .         .         .         .         .         .         .         .         .         .         .
 -1.00E+00. . . . . . . . . . . . . . . . . . . . . . . . . . . . . . . . . . . . . . . . . . . . . . . . . . .
          .                                                                                                   .
          .    5 K     *    *                                                                                 .
          .    3 B                                                                                       *    .
          .    3A       *                                                                                     .
          .    3 A           *                                                                                .
          .    6CB       * *                                                                                  .
          .    3 C         *                                                                                  .
          .    4 C           *                                                                                .
          .    3 B           *                                                                                .
  1.14E+01.    4 E*        2*                                                                                 ..
          .    2C    2                                                                                        .
          .    4C         *                                                                                   .
          .    2 B          *                                                                                 .
          .    3 D   2                                                                                        .
          .    7M        2*                                                                                   .
          .    32A  2                                                                                         .
          .    3 B         *                                                                                  .
          .    3 C      2                                                                                     .
          .    5 3 B   2                     *                                                                .
  2.38E+01.    3    C          *               2                                                              ..
          .    6B **   *                                                                                      .
          .    2    9                             *                                                           .
          .    3  6              *           *                                                                .
          .    *3        *                                                                                    .
    ID    .    2 B      2                                                                                     .
          .    *              *                                                                               .
          .    5 4 6    2        *                *                                                           .
          .    2 6              *                                                                             .
          .    2  7         2                                                                                 .
  3.62E+01.    3 B            *                                                                               ..
          .    6 R         **                                                                                 .
          .    3  B                        *                                                                  .
          .    2 *   *   *                                                                                    .
          .    3 6              *                                                                             .
          .    3   6    *    2                                                                                .
          .    3 A    2                                                                                       .
          .    38      *                                                                                      .
          .    *     2                                                                                        .
          .    *  4                *                                                                          .
  4.86E+01.    86C  * *     *                                                                                 ..
          .    494       *    *                                                                               .
          .    3A   *   *                                                                                     .
          .    3A   3                                                                                         .
          .    6 B *    4                                                                                     .
          .    * 6          *                                                                                 .
          .    **    *                                                                                        .
          .    2  8      2                                                                                    .
          .    6 M    2   *                                                                                   .
          .                                                                                                   .
  6.10E+01. . . . . . . . . . . . . . . . . . . . . . . . . . . . . . . . . . . . . . . . . . . . . . . . . . .
          .         .         .         .         .         .         .         .         .         .         .

Figure 11.3. An index plot of the independent variable, dose amount (AMT). Note the outlier at about ID = 3.

Figure 11.4 replots the same data as figure 11.3 but with the misrecorded values of the data items corrected. Figures 11.5 and 11.6 show the index plots for the other two data items of interest to this data analysis: weight (WT) and Apgar score (APGR).

             AMT VS.   ID
  -1.00E+00            1.34E+01            2.78E+01    AMT     4.22E+01            5.66E+01            7.10E+01
          .                   .                   .                   .                   .                   .
          .         .         .         .         .         .         .         .         .         .         .
 -1.00E+00. . . . . . . . . . . . . . . . . . . . . . . . . . . . . . . . . . . . . . . . . . . . . . . . . . .
          .                                                                                                   .
          .5    9B              *             *                                                               .
          .3     B                                   *                                                        .
          .3   A                     *                                                                        .
          .3    A                                *                                                            .
          .6   CB                     *      *                                                                .
          .3    C                            *                                                                .
          .4    C                                *                                                            .
          .3    B                                *                                                            .
  1.14E+01.4    E *                          2  *                                                             ..
          .2   C           2                                                                                  .
          .4   C                          *                                                                   .
          .2    B                               *                                                             .
          .3    C*          2                                                                                 .
          .7   M                       2  *                                                                   .
          .3   2A        2                                                                                    .
          .3    B                            *                                                                .
          .3      C                 2                                                                         .
          .5     3    B         2                                                              *              .
  2.38E+01.3             C                              *                                          2          ..
          .6 47   *   *         *                                                                             .
          .2            9                                                                                    *.
          .3      6                                         *                                  *              .
          .*   3                       *                                                                      .
    ID    .2    B                   2                                                                         .
          .*                                         *                                                        .
          .5     4    6            2                        *                                                *.
          .2     6                                         *                                                  .
          .2        7                         2                                                               .
  3.62E+01.3     B                                   *                                                        ..
          .6    R                            *  *                                                             .
          .3      B                                                                      *                    .
          .2    *           *         *                                                                       .
          .3     6                                         *                                                  .
          .3         6              *             2                                                           .
          .3    A              2                                                                              .
          .3  8                   *                                                                           .
          .*               2                                                                                  .
          .*         4                                             *                                          .
  4.86E+01.8  6  C       *     *                *                                                             ..
          .4   94                      *             *                                                        .
          .3   A        *           *                                                                         .
          .3   A        *2                                                                                    .
          .6     38   *            22                                                                         .
          .*    6                             *                                                               .
          .* *              *                                                                                 .
          .2      5 3                  2                                                                      .
          .6    M              2           *                                                                  .
          .                                                                                                   .
  6.10E+01. . . . . . . . . . . . . . . . . . . . . . . . . . . . . . . . . . . . . . . . . . . . . . . . . . .
          .         .         .         .         .         .         .         .         .         .         .

Figure 11.4. See figure 11.3; the outlier has been corrected.

              WT VS.   ID
   5.00E-01            1.14E+00            1.78E+00     WT     2.42E+00            3.06E+00            3.70E+00
          .                   .                   .                   .                   .                   .
          .         .         .         .         .         .         .         .         .         .         .
 -1.00E+00. . . . . . . . . . . . . . . . . . . . . . . . . . . . . . . . . . . . . . . . . . . . . . . . . . .
          .                                                                                                   .
          .                           C  F                                                                    .
          .                              F                                                                    .
          .           E                                                                                       .
          .                           E                                                                       .
          .               G     F                                                                             .
          .                     G                                                                             .
          .                           H                                                                       .
          .                           F                                                                       .
  1.14E+01.                     6  G                                                                          ..
          .                  G                                                                                .
          .                  H                                                                                .
          .                        E                                                                          .
          .                     I                                                                             .
          .               G  G                                                                                .
          .               H                                                                                   .
          .                     F                                                                             .
          .                                        H                                                          .
          .                              7                                                 F                  .
  2.38E+01.                                                                                   I               ..
          .     K                                                                                             .
          .                                                                                             C     .
          .                                           9                                       2               .
          .               5                                                                                   .
    ID    .                                        F                                                          .
          .                           2                                                                       .
          .                                     8                                                          B  .
          .                                     9                                                             .
          .                                                             B                                     .
  3.62E+01.                              F                                                                    ..
          .                     G  J                                                                          .
          .                                           F                                                       .
          .                  5                                                                                .
          .                                     A                                                             .
          .           2                                                           A                           .
          .                           F                                                                       .
          .        C                                                                                          .
          .                  3                                                                                .
          .                                                                 6                                 .
  4.86E+01.     D                  G                                                                          ..
          .                  J                                                                                .
          .           F                                                                                       .
          .           G                                                                                       .
          .                                     8  E                                                          .
          .                  8                                                                                .
          .  3                                                                                                .
          .                                                 C                                                 .
          .                  G        F                                                                       .
          .                                                                                                   .
  6.10E+01. . . . . . . . . . . . . . . . . . . . . . . . . . . . . . . . . . . . . . . . . . . . . . . . . . .
          .         .         .         .         .         .         .         .         .         .         .

Figure 11.5. Index plot for weight (WT)

            APGR VS.   ID
   9.00E-01            2.74E+00            4.58E+00   APGR     6.42E+00            8.26E+00            1.01E+01
          .                   .                   .                   .                   .                   .
          .         .         .         .         .         .         .         .         .         .         .
 -1.00E+00. . . . . . . . . . . . . . . . . . . . . . . . . . . . . . . . . . . . . . . . . . . . . . . . . . .
          .                                                                                                   .
          .                                                                 C                     F           .
          .                                                      F                                            .
          .                                                      E                                            .
          .                                                                 E                                 .
          .                                            V                                                      .
          .                                                                 G                                 .
          .                                                                            H                      .
          .                                                                 F                                 .
  1.14E+01.                                                      G          6                                 ..
          .                                                      G                                            .
          .                                                                 H                                 .
          .                                                                 E                                 .
          .                                                                                       I           .
          .                                            W                                                      .
          .H                                                                                                  .
          .                                                      F                                            .
          .                                                                 H                                 .
          .                      F                                                     7                      .
  2.38E+01.           I                                                                                       ..
          .K                                                                                                  .
          .                                                                                       C           .
          .                                            9                                          2           .
          .                                                                 5                                 .
    ID    .                                                                            F                      .
          .                                                                            2                      .
          .                                                                            8          B           .
          .                                 9                                                                 .
          .                                            B                                                      .
  3.62E+01.                                            F                                                      ..
          .                                                                            J          G           .
          .                                                                                                  F.
          .                      5                                                                            .
          .                                                                 A                                 .
          .2                                                                                      A           .
          .                                                                 F                                 .
          .           C                                                                                       .
          .                                                                            3                      .
          .                                                                                       6           .
  4.86E+01.                                                                            T                      ..
          .                                                      J                                            .
          .                                                                                       F           .
          .                                                                 G                                 .
          .                                                                            M                      .
          .                                 8                                                                 .
          .                                 3                                                                 .
          .                                                      C                                            .
          .                                                      G                     F                      .
          .                                                                                                   .
  6.10E+01. . . . . . . . . . . . . . . . . . . . . . . . . . . . . . . . . . . . . . . . . . . . . . . . . . .
          .         .         .         .         .         .         .         .         .         .         .

Figure 11.6. Index plot for Apgar score (APGR)

These plots will be useful in the next stage of model building.

4. Building the Structural Part of the Model

One must first consider the choice of the structural kinetic model. For the phenobarbital data, a monoexponential kinetic model has been chosen. Presumably, the basic structural kinetics are already known well enough for this well studied drug, and it is not necessary to explore the fits of other possible structural kinetic models to the data at hand. Rather, in this section we focus on the newer task to most users of NONMEM, the task of building the structural part of the model for the PK parameters.

4.1. A General Approach

It is generally advisable to start from the simplest reasonable model, and proceed toward greater complexity, stopping whenever further additions fail to improve the model fit. Thus, one needs several types of tools: (i) those to choose a "minimal" model, (ii) those to indicate what part of a current model needs to be altered or elaborated (called model diagnosis or model criticism), and (iii) those to judge whether an alteration or elaboration has led to an improved model.

With such tools, one proceeds step by step from the minimal model, running NONMEM and using the diagnostic tools at each step to suggest a single addition for the next step. The process will terminate when the judgement tools indicate no improvement by any of the additions suggested by the diagnostic tools, or when the diagnostic tools fail to suggest any more additions.

The NONMEM runs at this stage, since there will be many of them, should be made as short as possible. To do so, only the estimation, table and scatterplot features need be used; the Covariance Step need not, in general, be run.

4.2. The Minimal Model

As suggested above, the minimal model involves the simplest pharmacokinetic model (ADVAN) likely to fit the data, and the simplest possible structural PK parameter model: each parameter is simply identified with a separate element of Image grohtml-151583-16.png .

At this stage, the statistical model should also be very simple. Only one, or at most two Image grohtml-151583-19.png variables should be defined. These will usually affect (first) the scale parameter (which itself, is often a volume of distribution parameter) and (second) some other parameter influencing the overall kinetics. Since the overall kinetics exhibited in the data will usually be dominated by elimination, the second Image grohtml-151583-20.png should usually modify the rate constant of elimination or clearance. However, some (kinetic) data sets are dominated by absorption or distribution, and in such cases, the second Image grohtml-151583-21.png should probably modify the parameter most affecting these processes. A single Image grohtml-151583-22.png should usually suffice. Both inter- and intra-individual errors can conveniently be modeled as proportional, so that the determination of initial estimates of variances is made easier, and all such estimates are on the same scale, but this is a matter of taste. The model for the phenobarbital data defined in Chapter 2 (figure 2.6) almost fulfills the spirit of these restrictions. However, the inter- and intra-individual error models there are additive, rather than proportional. The minimal model used on the phenobarbital data in this chapter is therefore a modified version of that used in Chapter 2. It is:

Image grohtml-1515835.png

Image grohtml-1515836.png

Image grohtml-1515837.png

In (11.1), it is understood that Image grohtml-151583-26.png , and that Image grohtml-151583-27.png is the prediction of Image grohtml-151583-28.png from ADVAN1 using Image grohtml-151583-29.png and Image grohtml-151583-30.png . A control file to NM-TRAN that specifies this model, and instructs NONMEM to produce the desired output is:

$PROBLEM PHENOBARB SIMPLE MODEL (#1)
$INPUT ID TIME AMT WT APGR DV
$DATA PHENO
$SUBROUTINE ADVAN1
$PK
TVCL=THETA(1)
CL=TVCL*(1+ETA(1))
TVVD=THETA(2)
V=TVVD*(1+ETA(2))
K=CL/V
S1=V
$ERROR
Y=F*(1+ERR(1))
$THETAS (0,.0105) (0,1.05)
$OMEGAS .25 .25
$SIGMAS .04
$ESTIMATION
$TABLE ID TIME AMT WT APGR
$SCATTERPLOT PRED VS DV UNIT
$SCATTERPLOT RES VS (PRED,WT,APGR)
$SCATTERPLOT WRES VS (PRED,WT,APGR)

4.3. Use of Constraints

It is important to realize that constraints on elements of Image grohtml-151583-33.png or Image grohtml-151583-34.png may be part of a model.

For example, constraining clearance to be positive is a modelling choice. One might implement this constraint in NONMEM using a lower bound on the $THETA record, and this would assure that the estimate of clearance will be positive. It may not be necessary to do this; even without the lower bound, the data might clearly force the estimate to be positive.

Often, however, analysts will constrain the range of a parameter in the belief that doing so will shorten computing time or stabilize the search for the minimum of the objective function. While this benefit may be gained, the data may force the parameter estimate to the constraint boundary even though this boundary may not, in fact, represent a true modeling choice. In this case the proper action is to relax the constraint and rerun the problem. To do otherwise, and leave the parameter estimate to be the boundary value, implies that at the outset the user assumes that the parameter must be within the boundary and elevates the constraint to the status of a modeling choice. If an estimate lies on a boundary, NONMEM will print a warning message (along with the standard message regarding the status of the termination of the Estimation Step). The reader is cautioned to look for such a message, and in general, it is a good idea to check the values of the final estimates against the boundary values. Alternatively, the implementation of constraints that are not intended to represent modeling choices might be used cautiously and only if they really seem necessary to stabilize a search.

4.4. Diagnostic Tools

4.4.1. Plot of DV vs PRED

Most useful diagnostic tools are graphical. For an overall sense of the fit, a useful diagnostic plot is DV vs PRED. When there are substantial and systematic deviations from the line of identity, this plot suggests that there are problems with the fit, but it does not suggest what exactly these problems might be or what to do about them. This plot for the fit of the phenobarbital data to model (11.1) is seen in figure 11.7.

            PRED VS.   DV
   0.00E+00            2.60E+01            5.20E+01   PRED     7.80E+01            1.04E+02            1.30E+02
          .                   .                   .                   .                   .                   .
          .         .         .         .         .         .         .         .         .         .         .
  5.00E+00. . . . . . . . . . . . . . . . . . . . . . . . . . . . . . . . . . . . . . . . . . . . . . . . . . .
          .    .   *                                                                                          .
          .     .                                                                                             .
          .      .                                                                                            .
          .       .*                                                                                          .
          .        .                                                                                          .
          .       * *   **               *       *                                                            .
          .    *   * 2 * *                           *                                                        .
          .           .*                                                                                      .
          .        *   *2* *  *             *                                                                 .
  1.80E+01.          *  .*** 2*     *                                                                         ..
          .      *   * *23   *                                                                                .
          .          2 *  .  *2 ****                                        *                                 .
          .         *2 ***** * *           *                           *                                      .
          .            22  2. *  *                                                                            .
          .            3  *  **  *   **     *                                                                 .
          .            ** *2  3  *    * *                                                                     .
          .                 *  .  2                   *          *                                            .
          .               * **  . * *   *    *             *                                                  .
          .                 * *  ***   *  *                                                                   .
  3.10E+01.               ** *2   22                                                                          ..
          .               *    **  .                                                                          .
          .                  *   22*.* *                                                                      .
          .                  * *     .                                   *                                    .
          .           * *        *    .                                                                       .
    DV    .                * *         2         *  *                             *                  *        .
          .                    *   *    .                                                                     .
          .              *       *       .                                                                    .
          .              *                .                                                               *   .
          .                                .                                                                  .
  4.40E+01.                                 .                                                                 ..
          .                                  .                                                                .
          .                                   .                                                               .
          .                                    .                                                              .
          .                                     .                                                             .
          .                                      .                                                            .
          .                                       .                                                           .
          .                                        .                                                          .
          .                                         .                                                         .
          .                                          .                                                        .
  5.70E+01.                                           .                                                       ..
          .                                 *          .                                                      .
          .                                             .                                                     .
          .                                              .                                                    .
          .                                               .                                                   .
          .                                                .                                                  .
          .                                                 .                                                 .
          .                                                  .                                                .
          .                                 *                 .                                               .
          .                                                    .                                              .
  7.00E+01. . . . . . . . . . . . . . . . . . . . . . . . . . . . . . . . . . . . . . . . . . . . . . . . . . .
          .         .         .         .         .         .         .         .         .         .         .

Figure 11.7. Predictions from fit of model (11.1) to phenobarbital data vs observations themselves. The line of identity (...) shows where the points should, ideally, fall.

Figure 11.7 reveals that there is a group of points where the observation is much lower than the prediction. To begin to determine why this is so, it will be useful to look at residual plots. Such plots are the basis of the most important of the diagnostic tools.

4.4.2. Residual Plots

As mentioned in Chapter 2, a residual is the difference between an observation and its prediction. The prediction in this case (the same prediction as denoted by PRED) is the population prediction, i.e. the prediction for the typical individual having the given values for all the concomitant variables.

With population data, weighted residuals are often more informative than (plain) residuals. The weighted residuals for an individual are formed by transforming the individual’s residuals so that under the population model, and assuming the true values of the population parameters are given by the estimates of those parameters, all weighted residuals have unit variance and are uncorrelated. Weighted residuals are more informative for several reasons. First, since they have unit variance, or what is the same, unit standard deviation, "large" weighted residuals are those with absolute values greater than 3 or so. Second, loosely speaking, although plain residuals remove the structural model from the data, allowing one to see what part of the data is not (yet) modeled, they do not remove the statistical model (formally, they are still correlated). Weighted residuals have both models ’removed’ so any pattern in these is definitely not accounted for by the current model. This provides a more secure basis for future model building choices.

4.4.2.1. Index Plots of Residuals

Figure 11.8 is an index plot of residuals, which is a useful plot when combined with index plots of other data items. One can look for an association between unusual residuals and values of another data item. E.g. Are the largest discrepancies between model and data associated with certain (possibly extreme) values of the data item?

            RES  VS.   ID
  -9.00E+01           -6.60E+01           -4.20E+01   RES     -1.80E+01            6.00E+00            3.00E+01
          .                   .                   .                   .                   .                   .
          .         .         .         .         .         .         .         .         .         .         .
 -1.00E+00. . . . . . . . . . . . . . . . . . . . . . . . . . . . . . . . . . . . . ... . . . . . . . . . . . .
          .                                                                          .                        .
          .                                                                         2*  2                     .
          .                                                                *    **   .                        .
          .                                                                          .     2  *               .
          .                                                                 *   2    .                        .
          .                                                                      *   .* 3*                    .
          .                                                                          .    * **                .
          .                                                                          . 22                     .
          .                                                                        2 *                        .
  1.14E+01.                                                                 *      **.*                       ..
          .                                                                          .     *  *               .
          .                                                                          2   *   *                .
          .                                                                        **.                        .
          .                                                                          *  * *                   .
          .                                                                      *** . *   3                  .
          .                                                                          .*  **                   .
          .                                                                          .  *2                    .
          .                                                                  * * *   .                        .
          .                                     *          *        *               **                        .
  2.38E+01.     * *                   *                                              .                        ..
          .                                                                        * . * * 2    *             .
          .                                  *          *                            .                        .
          .                                                   *                   *  *                        .
          .                                                                          .    *                   .
    ID    .                                                                  **      .                        .
          .                                                                          . *                      .
          .                    *      *              *                            2  .                        .
          .                                                                      **  .                        .
          .                                                              **          .                        .
  3.62E+01.                                                                  *  *    .*                       ..
          .                                                                     **  ****                      .
          .                                                            * * *         .                        .
          .                                                                          2                        .
          .                                                                * * *     .                        .
          .                                       *           *                      .      *                 .
          .                                                                       2* .                        .
          .                                                                          .   ***                  .
          .                                                                          .  *                     .
          .                                                          *               .                        .
  4.86E+01.                                                                      *   2 *             *2*      ..
          .                                                                          .     *  *  *       *    .
          .                                                                          *   *  *                 .
          .                                                                          .    **       *          .
          .                                                                     * * 22                        .
          .                                                                      *   .                        .
          .                                                                          .       *                .
          .                                                            *     *       .                        .
          .                                                                         *. ** *  **               .
          .                                                                          .                        .
  6.10E+01. . . . . . . . . . . . . . . . . . . . . . . . . . . . . . . . . . . . . ... . . . . . . . . . . . .
          .         .         .         .         .         .         .         .         .         .         .

Figure 11.8. Index plot of residuals from fit of model (11.1) to phenobarbital data.

In the phenobarbital example, this is clearly so: The large negative residuals (i.e., predictions greater than observations), first noted in figure 11.7, are here seen to be associated with patients 22 to 32 or thereabouts. In figures 11.4 and 11.5 it is clear that these same patients are those who received the highest doses and who weigh the most. An obvious explanation, then, of the over-predictions is that they are in the patients who weigh the most, and because weight is not in the model, neither volume nor clearance is adjusted to be larger in such individuals, so that predictions are strictly proportional to dose alone and may be too large for these heavier patients.

4.4.2.2. Plot of WRES vs Independent Variable

Another way to see the association between weight (or dose) and the large residuals is to plot the residual against weight, say. Figure 11.9 is this plot, but where, for reasons already discussed, weighted residuals, rather than plain residuals, are used.

            WRES VS.   WT
  -3.10E+00           -1.92E+00           -7.40E-01   WRES     4.40E-01            1.62E+00            2.80E+00
          .                   .                   .                   .                   .                   .
          .         .         .         .         .         .         .         .         .         .         .
  5.00E-01. . . . . . . . . . . . . . . . . . . . . . . . . . ... . . . . . . . . . . . . . . . . . . . . . . .
          .                                                    .                                              .
          .                                                    .                                             *.
          . *      *                                           .    ** * *                   *    *    * 2    .
          .                                                    .                                              .
          .                                                    .     *       * *                              .
          .                             *          *           . *   *      *       *      * * *          *   .
          .                                                    .                                              .
          .                               *           * *      **   *      * *2                             * .
          .                                 *        *  *   *  ** 2  ** ** * * ****    *            *         .
  1.14E+00.                                                    .                                              ..
          .                       *            *    *          ** 2*   * ** ****                              .
          .                                   * * **    *  ** *.   **   *   *                                 .
          .                                                    .                                              .
          .                                   *       ****2*** .22**2     *                                   .
          .                                                    .                                              .
          .                                2 *            ** **.* *       *   *                               .
          .                                                    .                                              .
          .                                                    .                                              .
          .                                  **        *** ** *.    *                                         .
  1.78E+00.                                     * * * **    *  ***                                            ..
          .                                                    .                                              .
          .                                     *    *2        .    *                                         .
          .                                                    .                                              .
          .                                                    .                                              .
    WT    .                                *             *     .                                              .
          .                                                    .                                              .
          .                                                    .                                              .
          .                                                    .                                              .
          .                                                    .                                              .
  2.42E+00.                                                    .                                              ..
          .                                     *      *       .                                              .
          .                                                    .                                              .
          .                               *                    .                                              .
          .                                                    .                                              .
          .                                                    .                                              .
          .                *                    *              .                                              .
          .                                                    .                                              .
          .                                                    .                                              .
          .                                                    .                                              .
  3.06E+00.                                                    .                                              ..
          .                       *            *          *    .                                              .
          .                         * **          *            .                                              .
          .                                                    .                                              .
          .                                                    .                                              .
          .                                                    .                                              .
          .                                                    .                                              .
          .                          *         *               .                                              .
          .                    *             *  *              .                                              .
          .                                                    .                                              .
  3.70E+00. . . . . . . . . . . . . . . . . . . . . . . . . . ... . . . . . . . . . . . . . . . . . . . . . . .
          .         .         .         .         .         .         .         .         .         .         .

Figure 11.9. Plot of weighted residuals vs weight for fit of minimal model to phenobarbital data.

It is clear from figure 11.9, in a way that is particularly compelling, that it is precisely those individuals with the largest weight whose residuals are large and negative. This type of residual plot, where (weighted) residuals are plotted against some independent variable, is the single most useful diagnostic tool.

Systematic patterns of weighted residuals, then, suggest possible model improvements. For an independent variable that already appears in the model, such a pattern may suggest that the way in which it enters the model is incorrect; e.g., it might appear as having a linear influence on a PK parameter, and a curvilinear influence might be better, or it might affect additional PK parameters, beyond those it affects in the current model. An example of this will be seen shortly. For a variable that does not yet appear in the model, as in figure 11.9, such a pattern suggests that the element should appear.

Before examining what happens if patient weight is added to the model, a caution about residual plots is in order. Neither residuals, nor weighted residuals, should ever be plotted against the observations themselves. Such a plot will always show a correlation, spuriously suggesting a problem with the model. This is most easily appreciated by considering the simple model that gives rise to the constant-valued prediction given by the the mean of the observations. All positive residuals (observations greater than prediction) must then be associated with observations greater than the mean, while all negative residuals must be associated with observations less than the mean. Clearly, then, the residuals plotted against the observations must show a line with positive slope. This same type of association, although to a lesser degree, holds true, even in less extreme cases. The phenomenon is illustrated in figure 11.10.

Image +chapt11/fig11.10.ubuntu.epsi.png

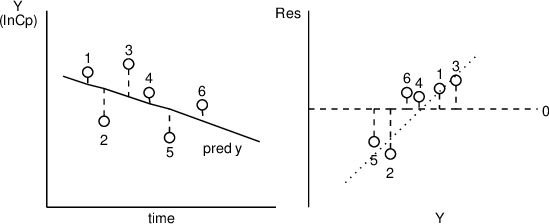
Figure 11.10. Residuals always correlate with the observations themselves; the more so, the less the model explains the data!

4.5. Judging Goodness of Fit

A more complex model is acceptable only if the complexity can be justified by some significant improvement in the fit. To evaluate whether this has been accomplished, several measures should be examined; no single measure suffices.

In the phenobarbital example, based on the finding in figure 11.9, a modified model is suggested. This model, (11.2), has (11.2b)=(11.1b), and (11.2c)=(11.1c), but

Image grohtml-15158312.png

which is a full model relative to the reduced model (11.1a), whence (11.2) is a full model relative to the reduced model (11.1).

The model-defining statements to NM-TRAN ($PK and $ERROR) now become:

$PK
TVCL=THETA(1)+THETA(3)*WT
CL=TVCL*(1+ETA(1))
TVVD=THETA(2)
V=TVVD*(1+ETA(2))
K=CL/V
S1=V
$ERROR
Y=F*(1+ERR(1))

We now examine some measures of goodness of fit, and see how (11.2) fares relative to (11.1).

4.5.1. A Global Measure — Change in the ObjectiveFunction

A global measure of goodness of fit is, of course, the objective function value based on the final parameter estimates, which, in the case of NONMEM, is minus twice the log likelihood of the data (see Chapter 5, Section 5.2.3). As noted in Chapter 5, if the new model differs from the previous model only by the addition of some new variable(s) (so that the two models form a full/reduced model pair), then the difference in objective function values has a known (approximate) statistical distribution. More informally, during model-building, a fall in objective function value of 4 when a single new parameter is introduced (and no old ones are eliminated) indicates that the new model has substantially improved the overall goodness of fit. Model (11.2) shows a decrease in objective function of 35.2 relative to (11.1), indicating considerable improvement.

4.5.2. Decrease in Unexplained Variability

The purpose of adding independent variables to the model is usually to explain kinetic differences among individuals. This means that prior to adding a variable, such differences were not "explained" by the model, and hence were part of random interindividual variability, although these differences could also have been reflected as a part of random intraindividual variability. Accordingly, elaboration of the model should be accompanied by a decrease in the estimates of the variances in Image grohtml-151583-41.png and/or Image grohtml-151583-42.png .

The estimates of Image grohtml-151583-43.png , Image grohtml-151583-44.png , and Image grohtml-151583-45.png from the fit to Model (11.2) are .057, .12, and .0196, corresponding to coefficients of variation of 24%, 35%, and 14%, respectively. The corresponding values from the fit to (11.1) are .25 (CV=50%), .14 (CV=37%), and .016 (CV=13%), so that a considerable reduction in the variance of clearance is seen.

4.5.3. Improvement in Plots

The last, and most useful, evidence confirming the value of elaborating a model is to find that the pattern(s) in the PRED vs DV and weighted residual plot(s) that suggested the need for the addition have now disappeared. Indeed, when a model is relatively complete, all weighted residual plots should show no pattern: the "unexplained" part of the data should have become featureless random noise.

Figures 11.11 and 11.12 correspond to 11.7 and 11.9, but are from the fit to model (11.2).

            PRED VS.   DV
   6.00E+00            2.40E+01            4.20E+01   PRED     6.00E+01            7.80E+01            9.60E+01
          .                   .                   .                   .                   .                   .
          .         .         .         .         .         .         .         .         .         .         .
  5.00E+00. . . . . . . . . . . . . . . . . . . . . . . . . . . . . . . . . . . . . . . . . . . . . . . . . . .
          ..      *                                                                                           .
          .  .                                                                                                .
          .   .                                                                                               .
          .    .*                                                                                             .
          .      .                                                                                            .
          .    *  ** *                         *          *                                                   .
          .*    * ***     *                  *                                                                .
          .        * .                                                                                        .
          .      *    ***** *                        *                                                        .
  1.80E+01.        *   *.**  ** **                                                                            ..
          .   *  *  *   2*2     *                                                                             .
          .        ** **   .    3   ** *                  *                                                   .
          .        *2  ** 2 *   **              *                                *                            .
          .            22   **. * *                                                                           .
          .           ** **    .2   *   *  *   *                                                              .
          .           * * *  ** 2*    * *   *                                                                 .
          .                  *    .**          **                                                             .
          .                 * 2     .*  * 2                *                                                  .
          .                    **   2* *           *                                                          .
  3.10E+01.               *   *    4*2.                                                                       ..
          .                  *     2    .                                                                     .
          .                    *  *******.                                                                    .
          .                    *  *        .           *                                                      .
          .              **          *      .                                                                 .
    DV    .                  *    *    *   ** .     *    *                                                   *.
          .                       *    *       .                                                              .
          .                 *        *           .                                                            .
          .                 *                     .                                        *                  .
          .                                        .                                                          .
  4.40E+01.                                          .                                                        ..
          .                                           .                                                       .
          .                                             .                                                     .
          .                                              .                                                    .
          .                                                .                                                  .
          .                                                 .                                                 .
          .                                                   .                                               .
          .                                                    .                                              .
          .                                                     .                                             .
          .                                                       .                                           .
  5.70E+01.                                                        .                                          ..
          .                                           *              .                                        .
          .                                                           .                                       .
          .                                                             .                                     .
          .                                                              .                                    .
          .                                                                .                                  .
          .                                                                 .                                 .
          .                                                                  .                                .
          .                                          *                         .                              .
          .                                                                     .                             .
  7.00E+01. . . . . . . . . . . . . . . . . . . . . . . . . . . . . . . . . . . . . . . . . . . . . . . . . . .
          .         .         .         .         .         .         .         .         .         .         .

Figure 11.11. Predictions from fit of model (11.2) to phenobarbital data vs observations.

Compared to figures 11.7 and 11.9, figures 11.11 and 11.12 indicate an improvement in that the Image grohtml-151583-46.png of large negative residuals is clearly reduced in both plots.

            WRES VS.   WT
  -3.50E+00           -2.22E+00           -9.40E-01   WRES     3.40E-01            1.62E+00            2.90E+00
          .                   .                   .                   .                   .                   .
          .         .         .         .         .         .         .         .         .         .         .
  5.00E-01. . . . . . . . . . . . . . . . . . . . . . . . . . . ... . . . . . . . . . . . . . . . . . . . . . .
          .                                                      .                                            .
          .                                                      .                                     *      .
          .*                  *                                  *    **  *                *** *      *       .
          .                                                      .                                            .
          .                                                      .     *  *  *                                .
          .                                   *  *               *    *        2        *  *       *         *.
          .                                                      .                                            .
          .                                   *   *   *  *     * .      2   ** *                        *     .
          .                                      *    *   *   * ** *2  * *   2* 2 *  **          *            .
  1.14E+00.                                                      .                                            ..
          .                              *       *  *            * ** 2**  **  ***                            .
          .                                       * * 2      ** *.2     *  * *                                .
          .                                                      .                                            .
          .                                      *       *2**  **3 *** ***  *            *                    .
          .                                                      .                                            .
          .                              *      * *          *  3.*     *      * *                            .
          .                                                      .                                            .
          .                                                      .                                            .
          .                                     **      * *  2   * *      *                                   .
  1.78E+00.                                       *        ***2* .        *     *                             ..
          .                                                      .                                            .
          .                                          *      *  2 .  *                                         .
          .                                                      .                                            .
          .                                                      .                                            .
    WT    .                                          * *         .                                            .
          .                                                      .                                            .
          .                                                      .                                            .
          .                                                      .                                            .
          .                                                      .                                            .
  2.42E+00.                                                      .                                            ..
          .                                    *                 .        *                                   .
          .                                                      .                                            .
          .                                   *                  .                                            .
          .                                                      .                                            .
          .                                                      .                                            .
          .                  *            *                      .                                            .
          .                                                      .                                            .
          .                                                      .                                            .
          .                                                      .                                            .
  3.06E+00.                                                      .                                            ..
          .                                    *  *  *           .                                            .
          .                           *  **               *      .                                            .
          .                                                      .                                            .
          .                                                      .                                            .
          .                                                      .                                            .
          .                                                      .                                            .
          .                               *            *         .                                            .
          .                         *    * *                     .                                            .
          .                                                      .                                            .
  3.70E+00. . . . . . . . . . . . . . . . . . . . . . . . . . . ... . . . . . . . . . . . . . . . . . . . . . .
          .         .         .         .         .         .         .         .         .         .         .

Figure 11.12. Plot of weighted residuals vs weight for fit of model (11.2) to phenobarbital data.

4.6. Using the Tools: Further Improvement

4.6.1. An Additional Effect of WT

While all of the above suggests that model (11.2) is superior to model (11.1), figure 11.12 shows a persistent linear relationship between weight and residuals. Thus, the addition of weight to the model for clearance does not fully exploit the information in the variable, weight. An obvious modification to model (11.2) that might deal with this is to have weight affect Image grohtml-151583-47.png as well as Image grohtml-151583-48.png . Accordingly, define model (11.3) such that (11.3a)=(11.2a), (11.3c)=(11.2c), but

Image grohtml-15158315.png

The model-defining portion of the control stream now becomes:

$PK
TVCL=THETA(1)+THETA(3)*WT
CL=TVCL*(1+ETA(1))
TVVD=THETA(2)+THETA(4)*WT
V=TVVD*(1+ETA(2))
K=CL/V
S1=V
$ERROR
Y=F*(1+ERR(1))

When model (11.3) is fit to the data, the objective function decreases fully 126 relative to model (11.2). Moreover, the estimates of Image grohtml-151583-52.png , Image grohtml-151583-53.png , and Image grohtml-151583-54.png are now .050 (CV=22%), .028 (CV=17%), and .011 (CV=10%), indicating a further substantial decrease in unexplained variation. The plots corresponding to 11.7/11.11 and 11.9/11.12 are shown as figures 11.13 and 11.14.

            PRED VS.   DV
   9.00E+00            1.78E+01            2.66E+01   PRED     3.54E+01            4.42E+01            5.30E+01
          .                   .                   .                   .                   .                   .
          .         .         .         .         .         .         .         .         .         .         .
  5.00E+00. . . . . . . . . . . . . . . . . . . . . . . . . . . . . . . . . . . . . . . . . . . . . . . . . . .
          .       *                                                                                           .
          .                                                                                                   .
          ..                                                                                                  .
          . * .                                                                                               .
          .      .                                                                                            .
          .         .   *  *     *2*                                                                          .
          .  *        *. *   *    * *            *                                                            .
          .              *.                                                                                   .
          .                  .2  *2*        *                      *                                          .
  1.80E+01.                     * *22 *    *                                                                  ..
          .          *           **5 *                                                                        .
          .                      *22* . *        *     *  *   *                                               .
          .                   *  *4**   *.          *     *   *                                               .
          .                        2*    * *. *  *   *                                                        .
          .                     *  *      ** * .    *      2  *              *                                .
          .                     * *2  **    *     .   2  *                  *                                 .
          .                                 * **     . *   *                                                  .
          .                               *   ** 2    * .         *            *                              .
          .                              *  * *      *    *. *                     *                          .
  3.10E+01.                                 *          * *2  .  *      *  *             *                     ..
          .                                               **    .  *                                          .
          .                                     **  2 *       ** * .                                          .
          .                                            *     2        .                                       .
          .                                          *       * *         .                                    .
    DV    .                                        * *      *             2 .     *      *        *           .
          .                                                 *       *          .                              .
          .                                                         * *           .                           .
          .                                                             *            .                      * .
          .                                                                             .                     .
  4.40E+01.                                                                                .                  ..
          .                                                                                   .               .
          .                                                                                      .            .
          .                                                                                         .         .
          .                                                                                            .      .
          .                                                                                               .   .
          .                                                                                                  ..
          .                                                                                                   .
          .                                                                                                   .
          .                                                                                                   .
  5.70E+01.                                                                                                   ..
          .                                                                                                 * .
          .                                                                                                   .
          .                                                                                                   .
          .                                                                                                   .
          .                                                                                                   .
          .                                                                                                   .
          .                                                                                                   .
          .                                                                                                  *.
          .                                                                                                   .
  7.00E+01. . . . . . . . . . . . . . . . . . . . . . . . . . . . . . . . . . . . . . . . . . . . . . . . . . .
          .         .         .         .         .         .         .         .         .         .         .

Figure 11.13. Predictions from fit of model (11.3) to phenobarbital data vs observations.

Now there are no obvious discrepancies, and the plot of weighted residuals vs Image grohtml-151583-55.png shows no pattern, so that it is likely that no further use of weight in the model is required.

            WRES VS.   WT
  -3.00E+00           -1.88E+00           -7.60E-01   WRES     3.60E-01            1.48E+00            2.60E+00
          .                   .                   .                   .                   .                   .
          .         .         .         .         .         .         .         .         .         .         .
  5.00E-01. . . . . . . . . . . . . . . . . . . . . . . . . . . . . . . . . . . . . . . . . . . . . . . . . . .
          .                                                     .                                             .
          .                                                *    .                                             .
          . * *                                *  * **          .        *  ***          *                    .
          .                                                     .                                             .
          .                                           **   *    .                                             .
          .                 *        *           *        *     . *   *   * *                *    *           .
          .                                                     .                                             .
          .                *              **          2     *   **  **                          *             .
          .                    *      *           2*            2* 2  *   * *  ***  **    *         *         .
  1.14E+00.                                                     .                                             ..
          .             * *                  *               *  .2* 2 *       2  *  **                        .
          .                           *  *   *  *      *  ***   *     *     *  *                              .
          .                                                     .                                             .
          .                          *          *    ****   *** .   2   ***2   *     * *                      .
          .                                                     .                                             .
          .                         * *     *               ** *.   *  *             *   *        *           .
          .                                                     .                                             .
          .                                                     .                                             .
          .                               *   *                2*    *  *     *              *                .
  1.78E+00.                                           *   *     .*    ***    * *                *             ..
          .                                                     .                                             .
          .                                          *        * .   *               *           *             .
          .                                                     .                                             .
          .                                                     .                                             .
    WT    .                                                  *  .   *                                         .
          .                                                     .                                             .
          .                                                     .                                             .
          .                                                     .                                             .
          .                                                     .                                             .
  2.42E+00.                                                     .                                             ..
          .                                                     . *                                         * .
          .                                                     .                                             .
          .                                                     .      *                                      .
          .                                                     .                                             .
          .                                                     .                                             .
          .      *                             *                .                                             .
          .                                                     .                                             .
          .                                                     .                                             .
          .                                                     .                                             .
  3.06E+00.                                                     .                                             ..
          .                                    *                .      *           *                          .
          .                                  *   *  *           *                                             .
          .                                                     .                                             .
          .                                                     .                                             .
          .                                                     .                                             .
          .                                                     .                                             .
          .                                                     .       *   *                                 .
          .                        *     *         *            .                                             .
          .                                                     .                                             .
  3.70E+00. . . . . . . . . . . . . . . . . . . . . . . . . . . . . . . . . . . . . . . . . . . . . . . . . . .
          .         .         .         .         .         .         .         .         .         .         .

Figure 11.14. Plot of weighted residuals vs weight for fit of model (11.3) to phenobarbital data.

4.6.2. The Effect of APGR

The structural model building stage is not over until all available independent variables have been examined for influence, and there is one additional variable, the Apgar score, that has not yet been seriously considered. A plot of the weighted residuals from the fit to model (11.3) vs Image grohtml-151583-56.png is shown in figure 11.15.

            WRES VS. APGR
  -3.00E+00           -1.88E+00           -7.60E-01   WRES     3.60E-01            1.48E+00            2.60E+00
          .                   .                   .                   .                   .                   .
          .         .         .         .         .         .         .         .         .         .         .
  8.00E-01. . . . . . . . . . . . . . . . . . . . . . . . . . . . . . . . . . . . . . . . . . . . . . . . . . .
          .   *                            *   *  * **          *    *   *  *                                 .
          .                                                     .                                             .
          .                                                     .                                             .
          .                                                     .                                             .
          .                                                     .                                             .
          .                                  *   *    **   *    *                                             .
          .                                                     .                                             .
          .                                                     .                                             .
          .                                                     .                                             .
  2.68E+00.                                                     .                                             ..
          .                                                     .                                             .
          .                                    *  2             .      *           *                          .
          .                                                     .                                             .
          .                                                     .                                             .
          .                                                     .                                             .
          .                                                     .                                             .
          .                    *                           *    .    *  *                                     .
          .                                                     .                                             .
          .                                                     .                                             .
  4.56E+00.                                                     .                                             ..
          .                                                     .                                             .
          .             *  *              * *      *  2     **  . * 2     *      2  **          2           * .
          .                                                     .                                             .
          .                                                     .                                             .
  APGR    .                                                     .                                             .
          .                                                     .                                             .
          .                                                     .                                             .
          .                           *      *            * 2* **2* 2 2     2 ***   **    *                   .
          .                                                     .                                             .
  6.44E+00.                                                     .                                             ..
          .                                                     .                                             .
          .                                                     .                                             .
          .               *          2*   *     *    **** *** ***2*22  ** *         **       *    * *         .
          .                                                     .                                             .
          .                                                     .                                             .
          .                                                     .                                             .
          .                                                     .                                             .
          . *                         *  *    * *     **  *  * *2   * 2*** 2*223     * * *   *  *             .
          .                                                     .                                             .
  8.32E+00.                                                     .                                             ..
          .                                                     .                                             .
          .                                                     .                                             .
          .                                                     .                                             .
          .      *          *      **    *   * * * **        *  .*    *** * * *          *        *           .
          .                                                     .                                             .
          .                                                     .                                             .
          .                                                     .                                             .
          .                                                     .                                             .
          .                                          *        * .   *                                         .
  1.02E+01. . . . . . . . . . . . . . . . . . . . . . . . . . . . . . . . . . . . . . . . . . . . . . . . . . .
          .         .         .         .         .         .         .         .         .         .         .

Figure 11.15. Plot of weighted residuals vs Apgar score for fit of model (11.3) to phenobarbital data.

There is a weak suggestion from figure 11.15 that for Image grohtml-151583-57.png less than 3, the weighted residuals tend to be negative. Accordingly, a new model (11.4) can be proposed, which is identical to (11.3) except that

Image grohtml-15158318.png

The relevant statements for NM-TRAN now become:

$PK
TVCL=THETA(1)+THETA(3)*WT
CL=TVCL*(1+ETA(1))
TVVD=THETA(2)+THETA(4)*WT
IF (APGR.LE.2) TVVD=TVVD*THETA(5)
V=TVVD*(1+ETA(2))
K=CL/V
S1=V
$ERROR
Y=F*(1+ERR(1))

When this model is fit to the data, Image grohtml-151583-61.png is estimated to be 1.18, implying that indeed, the volumes of distribution for infants with Apgar scores less than 3 are typically 18% higher than those of infants (of the same weight) with higher Apgar scores. The measures of improvement are now marginal, however: the objective function decreases only 3.7, and the decreases in the variances are all less than 10% of their previous values, with the variance of Image grohtml-151583-62.png actually increasing a few percent. Inspection of figure 11.6 suggests a reason for this: note that only 5 distinct individuals (separate symbols) have Apgar scores less than 3. There is simply not very much information about babies with low Apgar scores in this data set.

For completeness, figure 11.16 corresponds to figure 11.5, but using model (11.4), and now shows no distinct pattern.

            WRES VS. APGR
  -3.00E+00           -1.88E+00           -7.60E-01   WRES     3.60E-01            1.48E+00            2.60E+00
          .                   .                   .                   .                   .                   .
          .         .         .         .         .         .         .         .         .         .         .
  8.00E-01. . . . . . . . . . . . . . . . . . . . . . . . . . . . . . . . . . . . . . . . . . . . . . . . . . .
          .   *                                  2    *  2      .    *        * *           *                 .
          .                                                     .                                             .
          .                                                     .                                             .
          .                                                     .                                             .
          .                                                     .                                             .
          .                                       * *       * * . *           *                               .
          .                                                     .                                             .
          .                                                     .                                             .
          .                                                     .                                             .
  2.68E+00.                                                     .                                             ..
          .                                                     .                                             .
          .                                     3               .      *           *                          .
          .                                                     .                                             .
          .                                                     .                                             .
          .                                                     .                                             .
          .                                                     .                                             .
          .                  *                         *        .   *   *                                     .
          .                                                     .                                             .
          .                                                     .                                             .
  4.56E+00.                                                     .                                             ..
          .                                                     .                                             .
          .             *  *             *  *     *  **   *  *  . 3      *      2   **       * *             *.
          .                                                     .                                             .
          .                                                     .                                             .
  APGR    .                                                     .                                             .
          .                                                     .                                             .
          .                                                     .                                             .
          .                           *     *            * * 2**2*  22     *2 **    2   *                     .
          .                                                     .                                             .
  6.44E+00.                                                     .                                             ..
          .                                                     .                                             .
          .                                                     .                                             .
          .             *           *2   *     *    * 2* * * 2 3.*23   2 *         * *     *    * *           .
          .                                                     .                                             .
          .                                                     .                                             .
          .                                                     .                                             .
          .                                                     .                                             .
          . *                         *  *    * *    **   *  **2.   ***2* 2*2*3*     *  **  *   *             .
          .                                                     .                                             .
  8.32E+00.                                                     .                                             ..
          .                                                     .                                             .
          .                                                     .                                             .
          .                                                     .                                             .
          .     *          *       **    *  * * *  **      *    .*   * ***  * *          *        *           .
          .                                                     .                                             .
          .                                                     .                                             .
          .                                                     .                                             .
          .                                                     .                                             .
          .                                          *       *  .   *                                         .
  1.02E+01. . . . . . . . . . . . . . . . . . . . . . . . . . . . . . . . . . . . . . . . . . . . . . . . . . .
          .         .         .         .         .         .         .         .         .         .         .

Figure 11.16. Plot of weighted residuals vs Apgar score for fit of model (11.4) to phenobarbital data.

The stage of building the structural model is now complete.

5. Building the Statistical Model

5.1. Judging Among Alternatives

NONMEM can provide estimates of the Image grohtml-151583-63.png variables for each individual (see Chapter 12, Sections 4.11-4.13). Plots of the estimated interindividual differences, which can be regarded as interindividual residuals, can be obtained. Plots of these residuals (associated with a particular PK parameter) versus the values of an independent variable provide further help in building the structural part of the parameter model. Moreover, a plot of these residuals versus the typical values of the parameter (whose values depend on covariates) also provides help in building the model for interindividual differences themselves. For example, if interindividual differences are modeled with the additive model, but the plot shows a linear trend (in the boundaries enveloping the residuals), this suggests that a proportional model be tried.

Lastly, help can be provided in the selection of a model for intraindividual error. Predictions of concentrations, and hence residuals, based on estimates of individuals’ Image grohtml-151583-64.png s, can be computed, and the residuals can be plotted versus the predictions. (This requires advanced techniques.) Again, if intraindividual errors are modeled with the additive model, but the plot shows a linear trend in the envelope, this suggests that a proportional model be tried.

The statistical model is usually of less interest than the structural model, so that frequently all that is sought is an adequate model, not necessarily the correct one, nor does one care whether the estimates of the random effects parameters (the elements of Image grohtml-151583-65.png and Image grohtml-151583-66.png ) are particularly precise. Sometimes, however, the variability in the random effects is of genuine primary interest. In such cases more attention must be paid to building the random effects model. This, however, may not be easy because it is an unfortunate, but unavoidable fact, that a great deal more data is needed to estimate random effects parameters with a given precision than is needed to estimate fixed effect parameters with comparable precision.

The tools used to elaborate the statistical model are similar to those used for elaborating the structural model: alternative models are assessed using (available) residual plots, especially ones like those just discussed, and relative changes in the objective function.

5.1.1. Unexplained Variability

When the statistical model is developed, a new Image grohtml-151583-67.png variable may be added, or an old Image grohtml-151583-68.png variable used differently. Then differences in the Image grohtml-151583-69.png s between models cannot really be used to judge the benefit of the addition, and this evaluation tool becomes less useful. On the other hand, an addition of an Image grohtml-151583-70.png might be confirmed by a reduction in the estimates of the variances in Image grohtml-151583-71.png , the variances of the random components in the model for residual error. However, there is one sure sign that too many Image grohtml-151583-72.png ’s are in the model: NONMEM may estimate one or more of the Image grohtml-151583-73.png s to be zero, or very nearly zero. This can be disconcerting, particularly if the Image grohtml-151583-74.png variable is the only such variable affecting Volume, for instance, as then this estimate seems to suggest that with respect to Volume, there is no interindividual variability in the population whatsoever! The result should not be interpreted this way, however. Rather, assuming the Image grohtml-151583-75.png affecting Volume is the one most recently added, it indicates that given the previous statistical model, no Image grohtml-151583-76.png variability Image grohtml-151583-77.png to be ascribed to volume to explain all the variability seen. The data cannot support such an elaborate statistical model, and a simpler model, such as the previous one, must be used.

5.1.2. Residual Plots

The most important residual plot is now a plot of the weighted residuals against predictions, where a pattern in the shape of the outer envelope of points can indicate deficiencies in the statistical model (recall that a distinct pattern in the local "average" residual vs the predictions would indicate a defect in the structural model). This can be illustrated using the phenobarbital data. Figure 11.17 shows the plot of weighted residuals vs predictions for model (11.4), and figure 11.18 shows the same plot for a modified model, (11.5), identical to (11.4) except for

Image grohtml-15158321.png

Only the $ERROR statements of the control stream change:

$ERROR
Y=F+ERR(1)

WRES VS. PRED
-3.00E+00 -1.88E+00 -7.60E-01 WRES 3.60E-01 1.48E+00 2.60E+00
. . . . . .
. . . . . . . . . . .
9.00E+00. . . . . . . . . . . . . . . . . . . . . . . . . . . . . . . . . . . . . . . . . . . . . . . . . . .
. * . .
. . * .
. . .
. * . .
. . * .
. 2 . .
. * . * .
. * . * .
. * * . * .
1.82E+01. * ** . * * ..
. * * . 2 * * .
. * * * 2 2* *2 2 *3. 2*2 *** *** ** * * .
. * * * * * .
. . * * .
. * *. * .
. * . * * 2 * .
. * * * * . * * * * * * .
. * . * * .
. * * ** * * * *.
2.74E+01. * . * * ..
. * * * *.* * * * .
. * * . * * .
. * * * 2 . * * * .
. * * * * * . * * * .
PRED . * * . ** * ** * .
. .** * .
. * . .
. . * 2 .
. . .
3.66E+01. * . * ..
. * * . ** * .
. * . .
. * . .
. * * . * .
. . .
. . .
. . .
. * . .
. . .
4.58E+01. * . ..
. . .
. . .
. . .
. . .
. . .
. . .
. . .
. .* * .
. . .
5.50E+01. . . . . . . . . . . . . . . . . . . . . . . . . . . . . . . . . . . . . . . . . . . . . . . . . . .
. . . . . . . . . . .

Figure 11.17. Plot of weighted residuals vs predictions for fit of model (11.4) to phenobarbital data (proportional intraindividual error).

Although the plots do not differ greatly, there is a small suggestion in figure 11.18 that the envelope of weighted residuals is somewhat V-shaped with the apex of the V at PRED=0 (but which does not show on the plot), while in figure 11.17 the weighted residuals seem more homogeneous, and their magnitude seems less dependent on that of the predictions. That this impression is valid is suggested also by the increase in objective function of 7.6 in going from model (11.4) to (11.5).

            WRES VS. PRED
  -3.20E+00           -2.04E+00           -8.80E-01   WRES     2.80E-01            1.44E+00            2.60E+00
          .                   .                   .                   .                   .                   .
          .         .         .         .         .         .         .         .         .         .         .
  9.00E+00. . . . . . . . . . . . . . . . . . . . . . . . . . . ... . . . . . . . . . . . . . . . . . . . . . .
          .                                           *          .                                            .
          .                                                      .                  *                         .
          .                                                      .                                            .
          .                                             *        .                                            .
          .                                                      .                   *                        .
          .                                                    **.                                            .
          .                                                    * . *                                          .
          .                                         *            .*            *           *                  .
          .                                           *      *   .                                            .
  1.80E+01.                                               *  *   . *                                          ..
          .            *                                      *  .    * *                * *                  .
          .                        *          * ** * *    *   2  **2*  3*   *** * *           **              .
          .                                      **     2 * **  2* * *             *                          .
          .                                                      .*           *                               .
          .                                           *          .*                                           .
          .                                           *          .   2 *       *     *                        .
          .                  *                        *     *   *.     2      *   *                           .
          .                                             *        .   *   * **   *                             .
          .                                *                     .2      *            *  *                    .
  2.70E+01.        *                                         *   .                                          * ..
          .                           *                *         .*                    *  * *     *           .
          .                           *                       2  *         *  *  *                            .
          .*                           *                       * .      *        *                            .
          .                     *       *       * * *        *   .   *   *         *                   *      .
  PRED    .                           *                     *    .    *   * **         *                      .
          .                       *                              . *         2                                .
          .                                 *                    . *                                          .
          .                                                      .               *                            .
          .                                                      .          *  *  *                           .
  3.60E+01.                       *                      *       .              *                             ..
          .                                    *                 .        *                                   .
          .              *                                       .    *                                       .
          .             *                       *                .                          *                 .
          .                                  *                   .                                            .
          .                                                      .                                            .
          .                                                      .                                            .
          .                                                      .                                            .
          .                                                      .                                            .
          .                                         *            .                                            .
  4.50E+01.                                                      .                                            ..
          .                                                      .                                            .
          .                                     *                .                                            .
          .                                                      .                                            .
          .                                                      .                                            .
          .                                                      .                                            .
          .                                                      .                                            .
          .                                                      .                                            .
          .                                                  *   .                                            .
          .                                                      .                                 *          .
  5.40E+01. . . . . . . . . . . . . . . . . . . . . . . . . . . ... . . . . . . . . . . . . . . . . . . . . . .
          .         .         .         .         .         .         .         .         .         .         .

Figure 11.18. Plot of weighted residuals vs predictions for fit of model (11.5) to phenobarbital data (additive intraindividual error).

6. Refine Model

The goal of this stage is to check whether the model is as parsimonious as reasonable, since if it is not, certain important parameters may not be estimated with as good precision as can be achieved. Although up to this stage, one tries to avoid adding parts to the model which are not well supported by the data, it is nonetheless possible that a part added at one stage may seem unnecessary after adding another part at a later stage. Perhaps, for example, weight affects V, and V and CL are correlated in the population (independent of weight), but first the influence of weight on CL is examined, and later its influence on V is examined (this was the order illustrated above). Then initially, weight might appear to influence CL, although this influence might only derive from the correlation between the two PK parameters. Later, after the influence of weight on V is a part of the model, the influence of weight on CL might disappear. One wants to check this possibility and, if indicated, eliminate the influence of weight on CL from the model at the stage now being described. The basic technique at this stage, is to run the Covariance Step with the best model thus far, and look for parameters with confidence intervals that include the parameter’s null value, i.e., the value that causes the parameter to be effectively deleted from the model. A null value is usually zero (for a parameter quantifying an additive portion of the model), and sometimes unity (for a parameter quantifying a multiplicative part of the model). If such parameters are found, then one at a time, each can be set to its null value and the consequences examined as discussed above for the earlier model building stages.

Figures 11.19 and 11.20 show two pages of NONMEM output from a run fitting model (11.4) to the phenobarbital data, and implementing the Covariance Step. Figure 11.19 shows the final parameter estimates, and 11.20, their standard errors.

************************************************************************************************************************
********************                                                                                ********************
********************                                  FINAL PARAMETER ESTIMATE                      ********************
********************                                                                                ********************
************************************************************************************************************************
THETA - VECTOR OF FIXED EFFECTS  *********************
           TH 1      TH 2      TH 3      TH 4      TH 5
        7.50E-05  2.66E-02  4.62E-03  9.53E-01  1.18E+00
OMEGA - COV MATRIX FOR RANDOM EFFECTS - ETAS  ********
           ETA1      ETA2
ETA1    4.59E-02
ETA2    0.00E+00  2.63E-02
SIGMA - COV MATRIX FOR RANDOM EFFECTS - EPSILONS  ****
           EPS1
EPS1    1.10E-02

Figure 11.19. Parameter estimates from fit of model (11.4) to phenobarbital data.

************************************************************************************************************************
********************                                                                                ********************
********************                             STANDARD ERROR OF ESTIMATE                         ********************
********************                                                                                ********************
************************************************************************************************************************
THETA - VECTOR OF FIXED EFFECTS  *********************
           TH 1      TH 2      TH 3      TH 4      TH 5
        9.59E-04  9.24E-02  7.33E-04  7.48E-02  8.36E-02
OMEGA - COV MATRIX FOR RANDOM EFFECTS - ETAS  ********
           ETA1      ETA2
ETA1    2.25E-02
ETA2   .........  7.08E-03
SIGMA - COV MATRIX FOR RANDOM EFFECTS - EPSILONS  ****
           EPS1
EPS1    2.01E-03

Figure 11.20. Standard errors of parameter estimates from fit of model (11.4) to phenobarbital data.

6.1. Use of Standard Errors and Confidence Intervals

The null values of Image grohtml-151583-81.png through Image grohtml-151583-82.png are zero, while the null value of Image grohtml-151583-83.png is unity. Using the numbers from the figures, it is easily seen that for Image grohtml-151583-84.png and Image grohtml-151583-85.png , the parameter estimate minus the null value is a fraction of one standard error, and hence Image grohtml-151583-86.png and Image grohtml-151583-87.png may not be different from their null values.

As indicated in Chapter 5 (Section 4.2.2), an approximate (two-sided) 95% confidence interval for a parameter estimate is

Image grohtml-15158324.png

where Image grohtml-151583-89.png is the 97.5 percentile of the normal distribution ( Image grohtml-151583-90.png ) and Image grohtml-151583-91.png is the standard error of the parameter estimate. Therefore, for Image grohtml-151583-92.png , a 95% confidence interval is given by Image grohtml-151583-93.png 
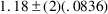
, which is 1.01 - 1.35. This range only barely misses including the null value, unity, indicating, as did the marginal change in the objective function associated with going from (11.3) to (11.4), that one cannot be very sure of the influence of Apgar score on volume.

Finally, note the magnitudes of the standard errors of the other parameters’ estimates. For Image grohtml-151583-94.png it is 16% of the estimate (i.e., the CV of the estimation error is 16%), for Image grohtml-151583-95.png it is 7.8%, while for the 2 elements of Image grohtml-151583-96.png it is 49% and 27%. This pattern is typical: the precision of the fixed effect parameter estimates is considerably greater than that of the random effects parameter estimates, except when the number of individuals sampled is enormous.

6.2. A Model Refinement

Based on the observation that Image grohtml-151583-97.png and Image grohtml-151583-98.png may be equal to their null values, these parameters are next set to their null values, defining a new (and final) model,

Image grohtml-15158325.png

Image grohtml-15158326.png

Image grohtml-15158327.png

which is communicated to NM-TRAN without changing the $PK or $ERROR statements, but simply by fixing the values of Image grohtml-151583-103.png and Image grohtml-151583-104.png to 0, using the FIXED option in the $THETA record:
$PK
TVCL=THETA(1)+THETA(3)*WT
CL=TVCL*(1+ETA(1))
TVVD=THETA(2)+THETA(4)*WT
IF (APGR.LE.2) TVVD=TVVD*THETA(5)
V=TVVD*(1+ETA(2))
K=CL/V
S1=V
$ERROR
Y=F*(1+ERR(1))
$THETAS (0 FIXED) (0 FIXED) (0,.0018) (0,.43) 1.0

When this model is fit to the data, the objective function increases only .12 (a trivial change). However, now the CV’s of the estimation errors in Image grohtml-151583-106.png and Image grohtml-151583-107.png are 4.4% and 2.5% respectively.

This is the main point of this section on model refinement; deletion of imprecisely estimated parameters can improve the precision of other parameter estimates. This is related to the correlation between parameter estimation errors, mentioned in Chapter 5. With little data from patients who weigh virtually nothing, Image grohtml-151583-108.png and Image grohtml-151583-109.png , the values of CL and V for such patients, are not well estimated (regardless of the fact that one might rationally model the values of these parameters to be 0), and so their parameter estimates are largely dependent on the estimates of the slope parameters Image grohtml-151583-110.png , Image grohtml-151583-111.png , and Image grohtml-151583-112.png . The correlation between the estimates of Image grohtml-151583-113.png and Image grohtml-151583-114.png is -.96, and that between Image grohtml-151583-115.png and Image grohtml-151583-116.png is -.95. Of course, since slope itself can only be well determined when the intercept is well determined, the parameter estimates of Image grohtml-151583-117.png , Image grohtml-151583-118.png , and Image grohtml-151583-119.png themselves largely depend on the estimates of Image grohtml-151583-120.png and Image grohtml-151583-121.png ; correlations are symmetric. In other words, neither type of parameter (intercept or slope) is very precisely estimated since the estimate of each depends on the value assigned to the other. But if one of the parameters can be eliminated from the model (i.e., rationally assigned a fixed value), then the other can be more precisely determined.

7. Testing the Model

This step is undertaken when it is desirable to assign p-values to the hypothesis test of one or more parameter values against null values. The procedure is as follows: Beginning with the final model resulting from all previous steps, each parameter to be tested is set, in turn, to its null value, and the reduced model is fit to the data (only the Estimation Step need be run; no tables, graphs or covariance output are necessary). A likelihood ratio test is done using the difference in minimum objective function values obtained with both the full (original) and reduced models. In doing this one must be careful that in the Estimation Step with a reduced model, no parameter other than the one under test (and those which are already constrained to fixed values under the full model) be constrained to a fixed value.

TOP

TABLE OF CONTENTS

NEXT