 be
be
 , and let
 and
and
 be the gradient (column) vector and hessian matrix,
respectively, of
be the gradient (column) vector and hessian matrix,
respectively, of
 evaluated at
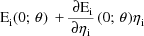
 . An approximation to
 is given by
Let
be
, and let
and
be the gradient (column) vector and hessian matrix,
respectively, of
evaluated at
. An approximation to
is given by

where
 is some estimate of
 , and
, and
 ,
,
 , and
, and
 are
are
 ,
,
 , and
, and
 all evaluated at
 . This results from applying a general approximation
approach to integrals, attributable to the French
mathematician Laplace, and described by De Bruijn (1961).
With
. This results from applying a general approximation
approach to integrals, attributable to the French
mathematician Laplace, and described by De Bruijn (1961).
With
 equal to the conditional estimate obtained by maximizing the
posterior density of
equal to the conditional estimate obtained by maximizing the
posterior density of
 (in an unconstrained manner) - call this the
unconstrained conditional estimate this particular
approximation has been used by others (Lindley, (1980);
Mosteller and Wallace (1964)), although not with a function
(in an unconstrained manner) - call this the
unconstrained conditional estimate this particular
approximation has been used by others (Lindley, (1980);
Mosteller and Wallace (1964)), although not with a function
 that is as complicated as that which often arises in
population pharmacokinetic and pharmacodynamic analyses. See
also: Tierny and Kadane (1986). In this particular case, the
last term of the approximation is 0. In general, the
approximation can produce reasonable results as long the
posterior distribution of
that is as complicated as that which often arises in
population pharmacokinetic and pharmacodynamic analyses. See
also: Tierny and Kadane (1986). In this particular case, the
last term of the approximation is 0. In general, the
approximation can produce reasonable results as long the
posterior distribution of
 is dominated by a single mode. On occasion, a randomly
dispersed parameter seems to have a multimodal distribution.
See the discussion in section B concerning mixture models
for a way to address this issue.
is dominated by a single mode. On occasion, a randomly
dispersed parameter seems to have a multimodal distribution.
See the discussion in section B concerning mixture models
for a way to address this issue.
Each of the estimation methods
uses a different variant of this approximation. However,
with whatever variant is used, when in particular, the
 are taken to be conditional estimates of the
 at
at
 and
and
 , the general method described in chapter I becomes what we
call a conditional estimation method. When the
approximation is used just as it is stated above, and when
the
, the general method described in chapter I becomes what we
call a conditional estimation method. When the
approximation is used just as it is stated above, and when
the
 are taken to be the unconstrained conditional estimates, the
method is called the Laplacian estimation method to
honor the individual whose approximation plays such an
essential role. However, the method itself involves an idea
which is peculiar to NONMEM implementation. Namely, the
approximation to L (the likelihood function of
are taken to be the unconstrained conditional estimates, the
method is called the Laplacian estimation method to
honor the individual whose approximation plays such an
essential role. However, the method itself involves an idea
which is peculiar to NONMEM implementation. Namely, the
approximation to L (the likelihood function of
 and
and
 ), resulting from using the Laplacian approximation, is
maximized.
), resulting from using the Laplacian approximation, is
maximized.
When mean-variance models are
used, the assumption can be made that each intraindividual
variance-covariance matrix
 is actually given by
 , the matrix for the mean individual. With this particular
assumption, there is said to be no
, the matrix for the mean individual. With this particular
assumption, there is said to be no
 -interaction see chapter I. The
 are computed differently, depending on whether an
 -interaction is assumed, as are the posterior modes. With
mean-variance models, by default, NONMEM implements the
Laplacian method assuming that there is no
-interaction is assumed, as are the posterior modes. With
mean-variance models, by default, NONMEM implements the
Laplacian method assuming that there is no
 -interaction. With the currently distributed NONMEM code it
is possible to apply the Laplacian method when there is an
-interaction. With the currently distributed NONMEM code it
is possible to apply the Laplacian method when there is an
 -interaction, but this code and its usage are not supported
by the NONMEM Project Group.
-interaction, but this code and its usage are not supported
by the NONMEM Project Group.
The matrix
 can be approximated by another matrix. Suppose given
 ,
,
 is comprised of statistically independent subvectors
 ,
,
 , etc., so that
 can be written as a sum over terms
 ,
,
 , etc. Then each of
 and
and
 can be written as a sum over terms
 ,
,
 , etc. and
 ,
,
 , etc., respectively. An approximation
 to
to
 is obtained by replacing each
 in the sum for
 by
by
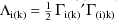 . This is a type of first-order approximation; terms
involving second derivatives have been dropped. It is called
the first-order approximation
. This is a type of first-order approximation; terms
involving second derivatives have been dropped. It is called
the first-order approximation
With this approximation, and
when all the
 are taken to be equal to the unconstrained conditional
estimates of the
are taken to be equal to the unconstrained conditional
estimates of the
 , the method is called the first-order conditional
estimation (FOCE) method
, the method is called the first-order conditional
estimation (FOCE) method
Actually, NONMEM allows the implementation of several versions of this method.
|
• |
When a mean-variance
intraindividual model is used, by default,
| |
|
• |
The first-order conditional
estimation method without interaction is the FOCE method
applied with intraindividual mean-variance models and
assuming no
|
When the first-order
approximation is used (with
 replaced by
 ), but when all
 are taken to be 0 (the population mean value of
 ), the method is called the first-order (FO) estimation
method
), the method is called the first-order (FO) estimation
method
With the first-order method, the
terms
 and
and
 in the Laplacian approximation are 0. Note that since
conditional estimates are not used, the first-order method
is not a conditional estimation method.
in the Laplacian approximation are 0. Note that since
conditional estimates are not used, the first-order method
is not a conditional estimation method.
It can be shown that when intraindividual mean-variance models are used, the method is equivalent to the first-order method as described, for example, in NONMEM Users Guide - Part I (also see e.g., Beal and Sheiner (1985)). Such an earlier description is also given below in section A.6. These earlier descriptions of the method apply only to mean-variance models. With the currently distributed NONMEM code it is possible to apply the FO method as defined above with intraindividual models that are not mean- variance models, but this usage is not recommended, and the code is not supported by the NONMEM Project Group.
Suppose certain (but not all)
elements of
 are chosen to be in a set
 , that the elements of
 corresponding to the elements of
 are taken to be 0, and that the remaining elements of
 are taken to be those given by the Bayes posterior mode of
 under the restriction that all elements of
 in
in
 are 0. The conditional estimate thus defined is an
example of a constrained conditional estimate. Suppose also
that the first-order approximation is made. Then the method
is a hybrid between the first-order method and the FOCE
method. Accordingly, this conditional estimation method is
called the hybrid method Note that with the
definition of the
are 0. The conditional estimate thus defined is an
example of a constrained conditional estimate. Suppose also
that the first-order approximation is made. Then the method
is a hybrid between the first-order method and the FOCE
method. Accordingly, this conditional estimation method is
called the hybrid method Note that with the
definition of the
 used with this method, in contrast with the definition used
with the FOCE and Laplacian methods, the last term in the
Laplacian approximation is not 0.
used with this method, in contrast with the definition used
with the FOCE and Laplacian methods, the last term in the
Laplacian approximation is not 0.
A hybrid method can be
considered that uses a weaker version of the first-order
approximation. Consider using the first-order approximation,
but only for the submatrix of
 consisting of just those partial second derivatives such
that the two variables with respect to which the
differentiation occurs are in
consisting of just those partial second derivatives such
that the two variables with respect to which the
differentiation occurs are in
 . This method is not supported with the currently
distributed NONMEM code.
. This method is not supported with the currently
distributed NONMEM code.
When the intraindividual models
are statistical linear models (linear in the parameters
 ), the first-order, first-order conditional, hybrid, and
Laplacian methods are all the same method, the classical
maximum likelihood method.
), the first-order, first-order conditional, hybrid, and
Laplacian methods are all the same method, the classical
maximum likelihood method.
The
 are assumed to be distributed in the population with mean 0.
When the population model fits the data well, this
will be reflected by the average,
are assumed to be distributed in the population with mean 0.
When the population model fits the data well, this
will be reflected by the average,
 , of the conditional estimates of the
 across the sampled individuals (at the values of the
population parameters given by the model) being close to 0.
(The converse does not necessarily hold.) When
across the sampled individuals (at the values of the
population parameters given by the model) being close to 0.
(The converse does not necessarily hold.) When
 is close to 0, the fit will be called centered There
is nothing about the methods defined above that insures that
the fit will be centered. There are infrequently arising
situations where the average is "far" from 0,
where the model does not fit well (as judged e.g. by the
differences
is close to 0, the fit will be called centered There
is nothing about the methods defined above that insures that
the fit will be centered. There are infrequently arising
situations where the average is "far" from 0,
where the model does not fit well (as judged e.g. by the
differences
 with mean-variance intraindividual models) and where a
method that is designed to better center the fit might be
tried (do see chapter III for some guidance). With a
centering estimation method the
with mean-variance intraindividual models) and where a
method that is designed to better center the fit might be
tried (do see chapter III for some guidance). With a
centering estimation method the
 are taken to be the unconstrained conditional estimates, and
the approximation to
are taken to be the unconstrained conditional estimates, and
the approximation to
 is given by

With NONMEM, there are centering
FOCE and Laplacian estimation methods (with no
 -interaction). A centering hybrid method is not implemented
in NONMEM.
-interaction). A centering hybrid method is not implemented
in NONMEM.
The first-order model is
the population model which results when for all i, the ith
given intraindividual model is a mean-variance model with
mean
 and variance-covariance matrix
 , and this model is replaced by another such model with
mean
, and this model is replaced by another such model with
mean
and variance-covariance matrix
 .
.
The linearity of the
 under this model implies that the population expectation of
 is
is
 , the prediction obtained by taking
 to be 0, its population mean. With mean-variance models, the
FO estimation method is sometimes described as the
application of the maximum likelihood method to the
first-order model that results from the given model, and
when using this method, it is usual to judge goodness of fit
by the differences
to be 0, its population mean. With mean-variance models, the
FO estimation method is sometimes described as the
application of the maximum likelihood method to the
first-order model that results from the given model, and
when using this method, it is usual to judge goodness of fit
by the differences
 . When a conditional estimation method is used instead of
the FO method, a centered fit may result, confirming that
the population mean of the
. When a conditional estimation method is used instead of
the FO method, a centered fit may result, confirming that
the population mean of the
 is 0. However, the given intraindividual models are used,
and they may be nonlinear in the
is 0. However, the given intraindividual models are used,
and they may be nonlinear in the
 . Therefore, conceivably,
 may be a poor approximation to the population expectation of
 , and for this reason alone, an apparent bias in the fit may
result. Experience suggests, though, that this should not be
a major concern (perhaps because the nonlinear effect is
small relative to the size of intraindividual variability in
the residuals). If one is concerned, there are a couple of
strategies one might use.
, and for this reason alone, an apparent bias in the fit may
result. Experience suggests, though, that this should not be
a major concern (perhaps because the nonlinear effect is
small relative to the size of intraindividual variability in
the residuals). If one is concerned, there are a couple of
strategies one might use.
First, the NONMEM program allows
the expectation of the
 to be estimated by means of a couple different types of
actual integration (and not just when the intraindividual
models are of mean-variance kind); see NONMEM Users Guide -
Part VIII. Second, when the intraindividual models are
mean-variance models, NONMEM allows the first-order model to
be obtained automatically from the given model and used with
the centering FOCE method. (If the first-order model is used
with the noncentering FOCE method, the result is the same as
that obtained with the FO method.) When a conditional
estimation method is needed (see chapter III), application
of the centering FOCE method to the first-order model that
results from the given model may yield adequate results, and
of course, the expectation of
to be estimated by means of a couple different types of
actual integration (and not just when the intraindividual
models are of mean-variance kind); see NONMEM Users Guide -
Part VIII. Second, when the intraindividual models are
mean-variance models, NONMEM allows the first-order model to
be obtained automatically from the given model and used with
the centering FOCE method. (If the first-order model is used
with the noncentering FOCE method, the result is the same as
that obtained with the FO method.) When a conditional
estimation method is needed (see chapter III), application
of the centering FOCE method to the first-order model that
results from the given model may yield adequate results, and
of course, the expectation of
 under the first-order model is simply given by
 . Moreover, due to the linearity of the intraindividual
models (of the first-order model) in the
. Moreover, due to the linearity of the intraindividual
models (of the first-order model) in the
 , the computational requirement is substantially less than
that incurred with application of the (centering or
noncentering) FOCE method to the given model. The savings in
CPU time is achieved at the expense of possibly using too
simple a model (and, of course is still not as great a
savings as is achieved with the FO method).
, the computational requirement is substantially less than
that incurred with application of the (centering or
noncentering) FOCE method to the given model. The savings in
CPU time is achieved at the expense of possibly using too
simple a model (and, of course is still not as great a
savings as is achieved with the FO method).
The first-order model may be used with the centering FOCE method, but not with the centering Laplacian method (because due to the linearity, the result would be the same as that obtained with the centering FOCE method). Be aware that when this model is used with the centering FOCE method, the conditional estimates produced by the method are based on the first-order intraindividual models (unlike whenever the noncentering FOCE method is used, where the conditional estimates are based on the given intraindividual models). It is possible nonetheless to obtain posthoc estimates based on the given intraindividual models, at the population estimates obtained from using the centering FOCE method with the first-order model. A centering hybrid method is not implemented in NONMEM.
On occasion, a model may need to
incorporate a randomly dispersed parameter that has a
possibly multimodal distribution. In this case a mixture
model may be useful. This is a model where for each i, there
are several possible intraindividual models,
 ,
,
 , ...,
 for
for
 , and it is assumed that the particular model that actually
describes
, and it is assumed that the particular model that actually
describes
 is one of these, but it is not known which one. It is
assumed that the probability that it is
is one of these, but it is not known which one. It is
assumed that the probability that it is
 is
is
 , where
 . Loosely put, the ith individual is chosen randomly from a
population divided into
. Loosely put, the ith individual is chosen randomly from a
population divided into
 subpopulations, their relative sizes either being known or
unknown. The subpopulation of which the individual is a
given member is not observable, but for each subpopulation,
a model for data from an individual from the subpopulation
is available. The mixing probabilities
subpopulations, their relative sizes either being known or
unknown. The subpopulation of which the individual is a
given member is not observable, but for each subpopulation,
a model for data from an individual from the subpopulation
is available. The mixing probabilities
 correspond to the sizes of the subpopulations and are
usually treated as parameters whose values are unknown and
are estimated. With NONMEM, these probabilities can be
modeled, i.e. related to covariables, and therefore, can
vary between individuals. The parameters of these
relationships can be estimated; they are included in
correspond to the sizes of the subpopulations and are
usually treated as parameters whose values are unknown and
are estimated. With NONMEM, these probabilities can be
modeled, i.e. related to covariables, and therefore, can
vary between individuals. The parameters of these
relationships can be estimated; they are included in
 . To indicate this generality, the
 may be written
 (the kth mixing probability for the ith individual).
Suppose, for example, that a clearance parameter of a pharmacokinetic model may be bimodally distributed in the population. Here is how this may be expressed with a population model. One may consider a mixture model with two intraindividual models for each individual: for the ith individual, one where the individual’s clearance is given by

and another where it is given by

(The parameters
 and
and
 are the first two elements of
 .) For each i, the value
 arises randomly (see chapter I). For each i, a choice
between the two intraindividual models is also viewed as one
being made in a random fashion, according to probabilities
arises randomly (see chapter I). For each i, a choice
between the two intraindividual models is also viewed as one
being made in a random fashion, according to probabilities
 and
and
 (
(
 ). As a result of this choice, a value
 , which is either
 or
or
 , is also "chosen". (Consequently, if after
 , say, is chosen, the value of
 does not influence the data.) From the point of view of not
knowing what choices between intraindividual models were
actually made, the distribution of the
does not influence the data.) From the point of view of not
knowing what choices between intraindividual models were
actually made, the distribution of the
 across individuals is a mixture of two normal distributions,
and the distribution of the
across individuals is a mixture of two normal distributions,
and the distribution of the
 is a mixture of two lognormal distributions.
The first two elements of the
random variable
 may have the same or different variances, i.e.
 may or may not equal
 . If these variances are sufficiently small, while the
parameters
. If these variances are sufficiently small, while the
parameters
 and
and
 are sufficiently far apart, and if both probabilities
 and
and
 are sufficiently large (however in this regard, the
variances, the
are sufficiently large (however in this regard, the
variances, the
 ’s, and the probabilities must actually be considered
altogether), the distribution of
’s, and the probabilities must actually be considered
altogether), the distribution of
 is bimodal. Often, the data may not allow all of the
different variances between mixture components, such as
is bimodal. Often, the data may not allow all of the
different variances between mixture components, such as
 and
and
 , to be well estimated, in which case the assumption might
be made that these variances are the same (a homoscedastic
assumption). With NONMEM, this can be done explicitly, or
alternatively, the "same
, to be well estimated, in which case the assumption might
be made that these variances are the same (a homoscedastic
assumption). With NONMEM, this can be done explicitly, or
alternatively, the "same
 " can be used with both mixture components, e.g.
 can be used in (3) and also in (4), instead of
 . NONMEM will understand that
 is symbolizing two "different
 ’s", each having the same variance.†
----------
† With NONMEM
Version IV, the same
 can also be used, and NONMEM will understand that it is
symbolizing two different
can also be used, and NONMEM will understand that it is
symbolizing two different
 ’s with the same variance, provided the first-order
estimation method is used.
’s with the same variance, provided the first-order
estimation method is used.
----------
Other examples of mixture models
may be given. See NONMEM Users Guide - Part VI, section
III.L.2 for an example where the mixture model describes a
mixture of two joint lognormal distributions for clearance
and volume, but which is not a bimodal distribution.
The differences between the models
 need not be differences concerning parameters; they could be
differences in model form. They can be any set of
differences whatsoever.
need not be differences concerning parameters; they could be
differences in model form. They can be any set of
differences whatsoever.
The likelihood for
 under a mixture model is
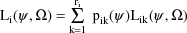
where
 is the likelihood function for
 under the the kth possible intraindividual model for
individual i. With a mixture model, any of the estimation
methods described in section A uses the defining
approximation for the method with each of the
under the the kth possible intraindividual model for
individual i. With a mixture model, any of the estimation
methods described in section A uses the defining
approximation for the method with each of the
 ,
,
 , ...,
 .
.
With a set of values for the
population parameters
 and
and
 , NONMEM classifies each individual into one of the
 subpopulations. The classification gives the most probable
subpopulation of which the individual is a member. For each
k, the empirical Bayes (marginal) posterior probability that
subpopulations. The classification gives the most probable
subpopulation of which the individual is a member. For each
k, the empirical Bayes (marginal) posterior probability that
 is described by
 , given
 , is computed by
 . The individual is classified into the kth subpopulation if
the kth probability is the largest among these r values.
. The individual is classified into the kth subpopulation if
the kth probability is the largest among these r values.
TOP
TABLE OF CONTENTS
NEXT CHAPTER ...
 is replaced by
 , where E represents the expectation over
 under the intraindividual model. With the currently
distributed NONMEM code it is possible to use the FOCE
method without doing this, but this code and its usage are
not supported by the NONMEM Project Group.
under the intraindividual model. With the currently
distributed NONMEM code it is possible to use the FOCE
method without doing this, but this code and its usage are
not supported by the NONMEM Project Group. -interaction. When the intraindividual variance is assumed
to be homoscedastic, and moreover, to be the same across
individuals, then there is no
-interaction. When the intraindividual variance is assumed
to be homoscedastic, and moreover, to be the same across
individuals, then there is no
 -interaction, and in this case it may be shown that the FOCE
method (without interaction) often produces results similar
to those obtained with a method described by Lindstrom and
Bates (1990). The first-order conditional estimation
method with interaction is the FOCE method applied with
intraindividual mean-variance models, but without the no
interaction assumption. FOCE with and without interaction
are both supported. With the currently distributed NONMEM
code it is possible to apply the FOCE method with
intraindividual models that are not mean-variance models,
but this code and its usage are not supported by the NONMEM
Project Group.
-interaction, and in this case it may be shown that the FOCE
method (without interaction) often produces results similar
to those obtained with a method described by Lindstrom and
Bates (1990). The first-order conditional estimation
method with interaction is the FOCE method applied with
intraindividual mean-variance models, but without the no
interaction assumption. FOCE with and without interaction
are both supported. With the currently distributed NONMEM
code it is possible to apply the FOCE method with
intraindividual models that are not mean-variance models,
but this code and its usage are not supported by the NONMEM
Project Group.